

“Should we be generating more AI content? Does it actually work?” We’re all entertaining questions like this. You can’t answer them without data.
I’ve been engineering reports on ROI and content performance for nearly ten years. Now that ércule manages AI content campaigns for clients, I’ve started pulling reports that isolate that data for AI content in particular.
I’m going to share four different reports that you can use. Each comes from a different reporting platform. Two of them are free, and two are not. These reports could be applied to any and all content in your library but I’ll show you how each one is particularly useful for understanding (and improving) AI content.
TL;DR
- Hubspot reports identify the warm leads who engage AI content
- Vector de-anonymizes visitor data to identify new leads
- GA4 reports identify AI content that buyers read before converting
- The ércule app monitors AI content performance in aggregate
I collect data around AI content for a few reasons…
It all basically comes down to validating ROI and maintaining content quality. The reports that focus on conversion enable me to make clear arguments for the value of AI content. Additionally, I track traffic and engagement for AI content to keep an eye on continued content performance.
The reports I’m describing in this article are useful for a variety of reasons:
- ROI accountability. Isolating metrics for AI content forces an honest evaluation of whether that investment is actually paying off.
- Lead quality signal. Tracking warm lead engagement with AI content helps to validate (or challenge) whether this content is actually nudging prospects toward a purchase.
- Conversion attribution. By identifying the various funnel stages where AI content is driving conversion, I can build a concrete case for the value of AI in pipeline.
- Audience fit analysis. Checking visitor job titles and company profiles against an ICP reveals whether AI content is attracting the right people or just placating search engines.
- Comparisons with artisanal content. Measure AI content performance in the aggregate is a great way to validate its value in comparison to human-generated content.
- Ongoing maintenance. Monitoring performance is necessary for all content but AI content, in particular, has a documented pattern of spiking then collapsing in traffic. It’s worth keeping an eye on.
I track similar metrics for all content, of course, whether it’s generated by humans, or AI, or both. Since AI content is an emerging form of content, marketers need all of the data that we can get. When I have data specific to AI programs I’m better equipped to advocate for them. I’m also better equipped to improve them.
“Which of our leads are engaging with AI content?” (Hubspot report)
This report is looking specifically at how leads in our CRM are engaging with content. As you’ll see in the example below, it counts the number of leads who engage with each URL.

You can then click into each page report and see who, specifically, was looking at that content. If any AI content that is resonating with critical leads then this report will show you. (You can go one step further and connect this with actual deals if your CRM hygiene is good.)
From a marketing ROI perspective, this report enables you to say, “Warm leads have engaged with this AI content page 43 times this month, and this other page 29 times…”
(As with all things Hubspot, setting up such reports can be pretty labor-intensive.)
“Who is viewing our AI content?” (Vector report)
De-anonymization tools like Vector offer a wider lens than CRM reports. Vector reports provide the identities of nearly everyone who reads your content.

👆This report identifies their businesses, locations, and job titles. With this data you can analyze how well this AI content is resonating with your ideal customer profile. As with the Hubspot report, you can use this data to better understand individual pieces of AI content. Vector provides pretty granular data on these visitors.
Even if you spot a little signal in these reports it can tell an encouraging story for stakeholders.
“How does AI content influence conversions?” (GA4 report)
The UX is a bit rough but GA4 is great for setting up simple, relational reports. I use it to set up marketing funnel reports. They provide a simple but reliable metric, showing how frequently was AI part of the buyer’s journey.
For example, I set up a very basic, two-step report:
- Step one: did the person view some specific content?
- Step two: did that same person also convert?

You can customize those fields for any specific content and any specific conversion actions. You could customize it to track people who read your content about “data governance” and then later on downloaded a whitepaper.
You could customize it for people who landed on AI content and then later on signed up for a webinar, or a product demo, or any combination of actions.
The report shows you how many people viewed the content and how many of them completed the “key event” (i.e. conversion).

In this case, 3% of visitors to the AI content wound up converting in the past three months. That’s ten conversions. Depending on how much a conversion is worth to your sales team, this could be a mighty valuable piece of content.
I like these reports because they reflect the non-linear nature of the buyer’s journey. If somebody scanned your AI content and then converted three months later, after reviewing your product tutorials and reading customer reviews, it’s still reflected in this report.
“How is AI content performing in aggregate?” (ércule report)
This is a question that you could, theoretically, answer with GA4… But GA4 makes it exceedingly difficult to set up such simple reports. It’s designed much more for engineers than marketers.
The ércule app is designed for marketers. Using the same data from GA4 and Google Search Console, it allows you to group any number of pages into one single performance report.
You could group pages by topic, or by URL subfolders, or create a group just for your documentation pages. For example, there are some default groups that show all of your high-traffic pages together👇.

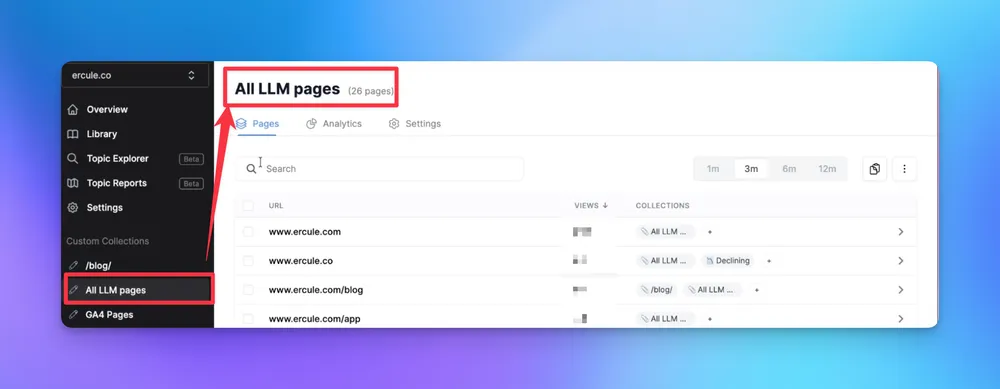
I create groups that are specific to AI content. I’ve labeled mine, “LLM pages.”

It shows me traffic, engagement, and search performance data for all of my AI-generated pages in the aggregate.

This wide lens is useful for proving the value of AI content on the whole. It’s also useful for monitoring basic content maintenance. AI content has some unique, and occasionally severe, maintenance issues.
AI content performance can nosedive quickly
Content maintenance is increasingly important for teams who are publishing at scale. If you’re publishing AI content then there’s a real risk of the “Mount AI” phenomenon.
It’s a term that the SemRush team has been talking about lately.

When companies go hard on hyper-scaling AI content (which usually coincides with a looser grip on content quality) they often see short term traffic increases that plummet soon after. It creates a steep, mountainous profile in the traffic and engagement reports.
If you’re reading this blog post at all then, I’d bet, you’re resisting the temptation to produce a thousand pieces a month. Still, as search engines grow more vigilant with flagging AI content, the long-term viability is far from certain.
The only way to manage it is to continuously monitor performance.
AI content is driving result for marketing programs
I think everyone engaging in this project should maintain a healthy skepticism about AI writing. Clear, continuous data is vital for everyone in the AI debate, especially folks like me, who are trying to engineer reliable content systems.
The reports I highlighted in this article allow me to keep refining AI systems. They also allow my clients to advocate for smarter marketing budgets. I’ve seen the most staunchly skeptical stakeholders soften at the sight of a well designed ROI report.
If you’re ever curious about how to engineer these reports, step by step, sign up for one of our webinars or send us a DM.
