

Sooner or later the CFO is going to ask: “How are these content channel investments doing?”
Many of us have the impulse to say, “Content doesn’t work like that! The channels are really diffuse and we can’t track them like ads! We just need content! It’s important!” Which is true, for the most part. But it’s not going to fly with your stakeholders.
So I’m highlighting four data reports you can use to tell a compelling story about the ROI of content:
- LLM visibility + engagement
- Overall inbound engagement
- Funnel-stage engagement
- Warm lead inbound
You can’t track content conversion like you track ads
Compared to organic content, ad conversion measurements are a cakewalk. The sites of ad engagement are consistent. The journey from ad to conversion is short and direct. The value of individual ads can be measured with A/B tests. There’s an entire industry devoted to tools and analytics for ads.
Not so with organic content. Organic content is, basically, all content that isn’t an ad – everything from emails to whitepapers to blog posts. It’s extremely diverse in terms of channels and formats. You can’t A/B test entire blog posts to optimize them. You can't get information about what's resonating with visitors by turning little switches on and off, turning up spend here, turning down spend there.
Organic content impact is tied to more fundamental concerns
The only way that we can think about and establish a content program is by engaging with deeper questions. Questions like…
- What ideas are we trying to talk about?
- Do they resonate with visitors?
- Do we have the right product?
- Are we explaining it well?
Content success depends on thoughtful answers to these questions. That’s why tracking content ROI will never be that same as ad performance or outbound performance.
Still, we have to quantify the impact of content somehow. The diversity of forms and channels doesn’t need to be a discouraging factor. Content touches customers and prospects in countless ways and scenarios so there are lots of potential data sources to understand the ROI.
LLM visibility and trust-building metrics
Buyers are turning more and more to ChatGPT for product research. Building trust with buyers is a matter of increasing visibility and credibility – two things which we can measure pretty well by tracking LLM inbound data.
Here’s a simple report that measures those metrics by topic. If you’re trying to best your competitors in LLM search, this is a way to make sure that you’re doing so in a strategic way.
So let’s get into some of them.

The data I’ve pulled here answers some basic questions about LLM search performance:
- Is your brand showing up in LLM search?
- How does your LLM visibility compare to your competitors’?
- Is that visibility increasing at all?
- Are you getting impressions in traditional Google search?
- Are you getting clicks through Google search?
It’s pretty boring data, I must admit, but it quantifies your value pretty clearly in LLM search. (Also, it’s relatively easy to measure). We’re measuring impressions, brand impressions, citations, clicks. All of this is a source of value.
Next, let’s bring our scope a little bit further down the funnel, from the search channel to your website.
Correlating conversions with content views
B2B buyers tend to visit a brand’s site numerous times before they make a decision on whether to convert or not. They might be reading your blog, your research report, case studies, and client stories.
“How frequently is content a part of the conversion journey?” That’s the question you can answer with this next data set.
One simple method that I use is by pulling this particular GA4 report to measure overall content ROI.

This report breaks up all visitor data into three groups:
- All visitors
- Visitors who convert
- Visitors who saw content and converted
Functionally, it’s a pretty simple report. It identifies whether a visitor to the website landed on any content-focused URLs (like /blog pages, or any subfolder you choose). Then it identifies whether that visitor completed a key event (like completing a lead capture form).

Stratify the results to see which pages drive the most conversions
You can break out every single page in the report to see how it touches the conversion journey. From this data you can also extrapolate which topics and formats are resonating the most with your audience.

For most of our clients, about half of conversions touch content. (As I noted, “content” can be a very broad category, including blogs, whitepapers, webinars, any material that buyers find before they land on conversion pages.)
We can also get a more granular look at how your content is influencing funnel movement. The next report is designed for that.
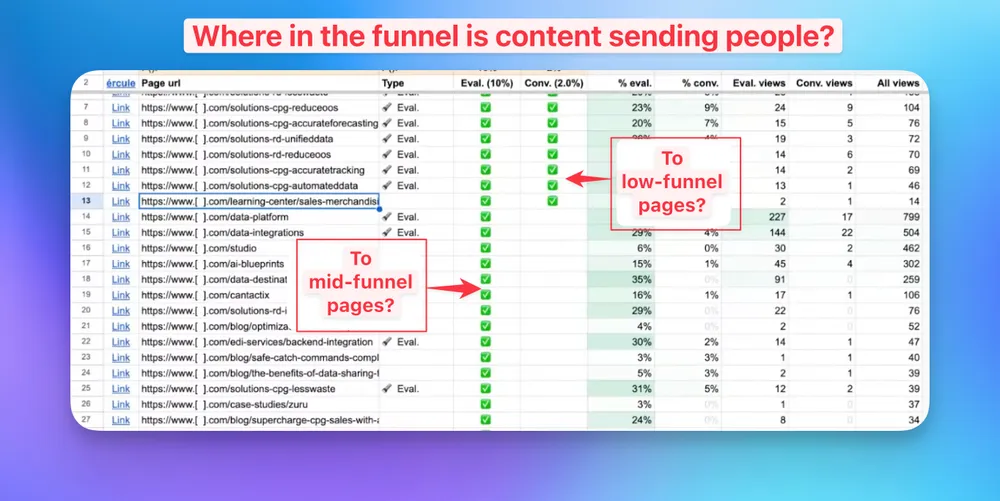
Correlating content with buyer’s journey engagement
The previous report answered a binary question: is content part of the conversion journey?
The next report can qualify that information a little more.

It will show you how often a given page is driving viewers to an evaluation-stage piece of content (like a brand comparison page) or a conversion-stage piece of content (like a demo page).
I built this one in GA4. It’s pulling click data from individual URLs and assigning the clicked links to funnel stages. In the above example, the blog content is driving more traffic overall to evaluation-stage pages but conversion-stage pages are present in the data, too.
You can use this data to tell a more compelling story about how content is guiding the buyer’s journey.
Tracking content engagement with CRM data
I use those GA4 reports all the time to help clients understand their inbound program but those reports don’t really account for qualified leads.
Integrating inbound data with CRM data allows you to bring that sales perspective to the fore. I have this HubSpot report that tracks traffic from the contacts in my CRM.

It shows me that traffic. We can chop up to understand how much traffic is coming from:
- Website content
- Organic search
- LLMs
- Referrals
Full disclosure: of all the reports that I’ve mentioned in this article, these HubSpot numbers are probably the hardest to get right. It’s going to require some pretty hands-on implementation and engineering.
This is only the beginning
There are tons of opportunities for enriching this data to get even more precise views of ROI.
- Did we produce a campaign that was used in outreach?
- Did we produce an asset?
- Did we write a blog post that was used as part of that motion?
- Did we answer some customer questions on the site?
- Did we answer some objections?
- Did we provide pricing information?
That's a whole separate set of questions that you can use to optimize individual pieces of content and the overall content system.
